Prerequisites
You must complete Tutorial 6 first.
Tutorial 6 is assumed knowledge for this tutorial. If you have not completed tutorial 6 please do so before attempting this tutorial.
Note
When testing your scripts, they may frequently crash. If this happens, you should not just start a new session in the browser. You should close the browser window(s), and start the browser again. This allows the browser to free up any resources left in use at the time of the failure.
Using alert()
When your scripts don't work as expected, the simplest form of debugging is to add an alert to them.
Suppose you wanted to check a value being used in your onClick logic for a button:
Open the Projects Home Page. Select your project and then use the Work as Developer option.
Sign on to aXes and then to a 5250 session.
Display the IBM i Main Menu.
Start the axes demo, and go to any employee's details.
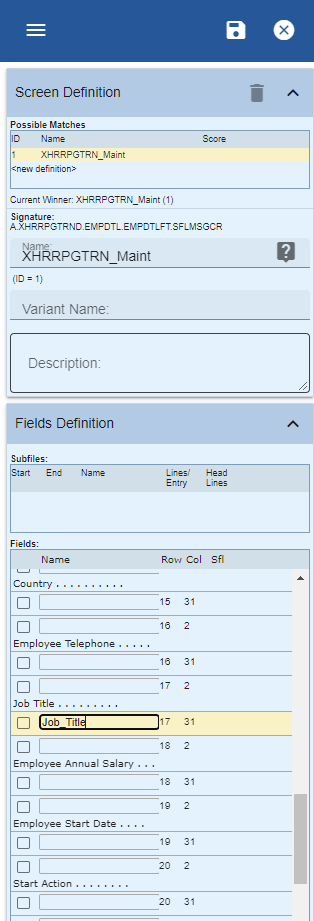
Next you need to identify a field on the screen so that you can debug its value. To do this, name the Job Title field Job_Title in the Screens tab like this:
Click on the job title field:

Display the Screens tab and note that the field is automatically selected. Give it the name Job_Title and click the Save button:
Now edit the screen by clicking the eXtensions tab and locking the screen for editing.

Add a new element.
Select Push Button eXtension from the Extension Toolbox then drag and drop it onto the screen panel.
Give the button the caption Debug with an alert
Now edit the onClick property. Replace the code with this:
var F = FIELDS("Job_Title");
var value = F.getValue();
alert("The value in the job title field is: " + value );
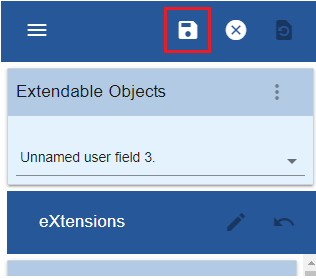
Close the script editor and then save
Now, if you click the button, you can see the value being processed, in the alert window.

Debug Basics
Instead of using alert, you can use a DEBUG statement. This produces a similar result, but it puts the output from all DEBUG statements into the same window.
Add a new push button to the employee maintenance screen, with the caption Output to Debug
Edit the onClick property and add this code
var myField = FIELDS("Job_Title");
var value = myField.getValue();
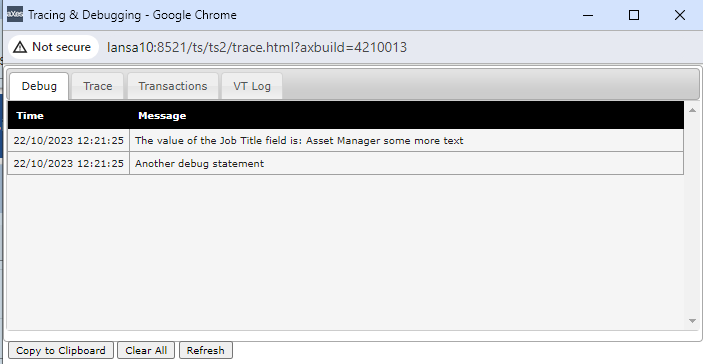
DEBUG("The value of the Job Title field is:", value, "some more text" );
DEBUG("Another debug statement");
Save your changes
Note that the format for DEBUG is slightly different. The values to be concatenated are separated by commas, and you can have as many values as you want.
When you click on the button, a debug window is opened, showing all debug statements.
Tracing Basics
Sometimes, an alert interrupts the flow of processing too much. Tracing allows you to watch what happens with less impact.
Add a new push button to the employee maintenance screen, with the caption Output to Trace
Edit the onClick property and add this code
var F = FIELDS("Job_Title");
var value = F.getValue();
TRACE("The value in the job title field is: ", value, " more text ", " and more text" );
Note the use of the TRACE command. You can specify as many parameters as you want. The TRACE will concatenate them and send them to the trace window.
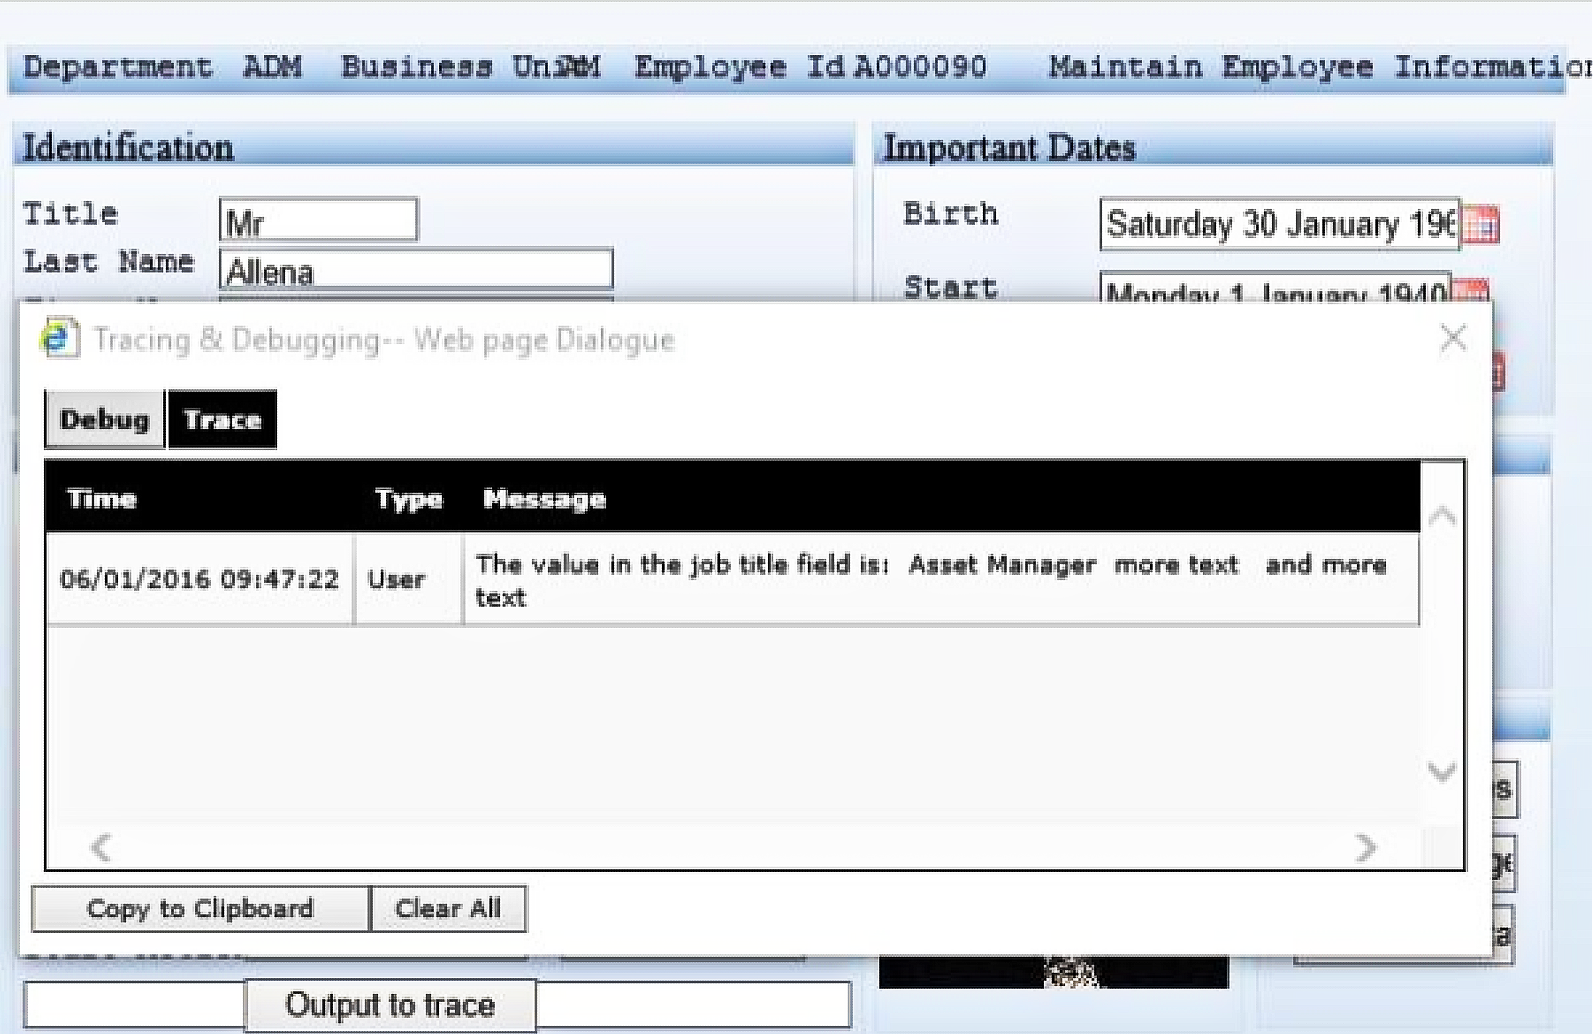
To see the trace output, save your changes and exit aXes.
Now open the Projects Home Page. Select your project and then use the Work as Developer (Tracing) option.
Navigate back to the employee maintenance screen and press the Output to Trace button. The trace information appears in the trace window
TRACE statements can be left in your code. They will only have an impact if aXes is running in trace mode.
Debugging Tools and Options
It is also possible to use the Modern browsers Developer Tools to debug your scripts.
Modern browsers comes with a built-in script debugger .Several things that you need to check or configure before you start debugging your scripts.
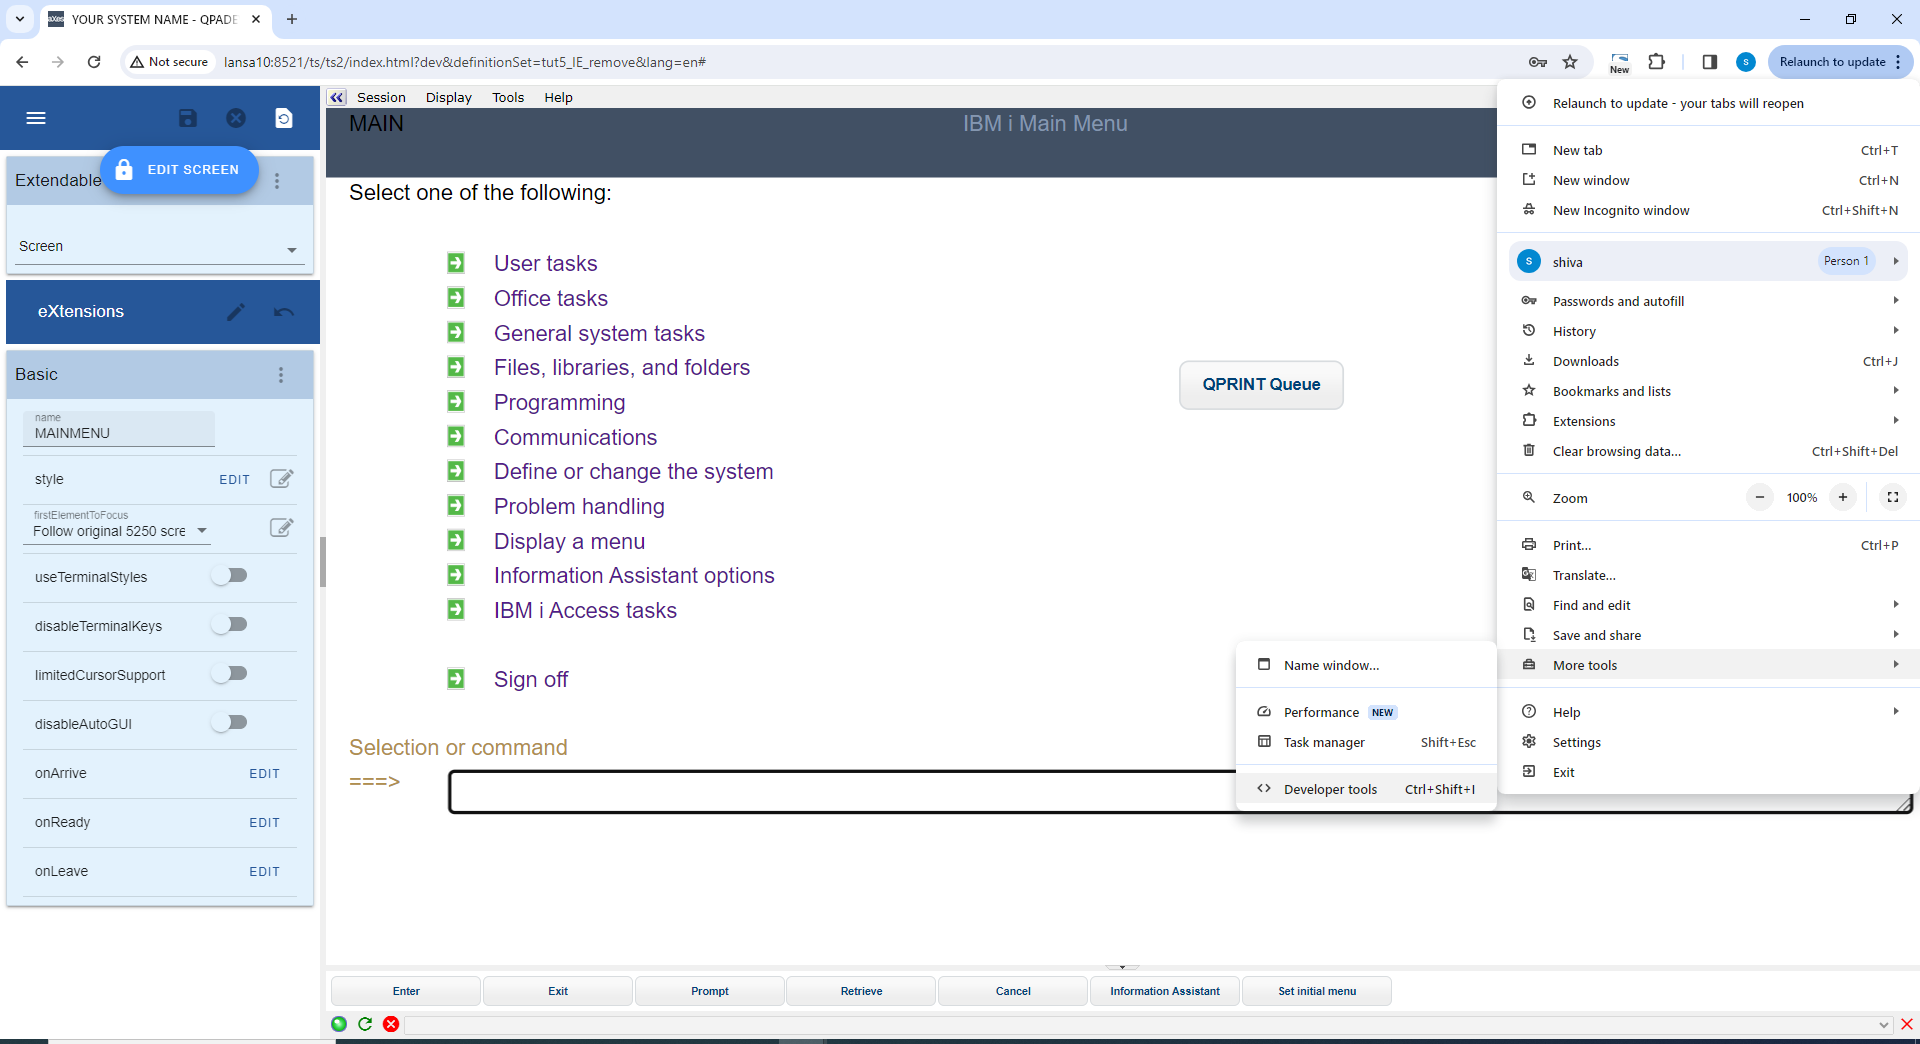
Select the “Developer Tools” option from the “More Tools” menu.
How to force Modern Browsers to enter debug mode so you can step through your script line by line?
Suppose that you have the following fragment of code in your button event handler, which has a deliberate error in it (F.setvalue instead of F.setValue):
Modify the onClick code for the QPRINT Queue button, on the main screen , to contain this code:
var F = FIELDS("CommandLine"); F.setvalue("WRKOUTQ QPRINT"); SENDKEY("Enter");
You will want to step through the script, line by line while at the same time watching the changes in the variable values. The easiest way to tell browser that you want to debug this piece of code is by putting statement “debugger” at the beginning of this code fragment.
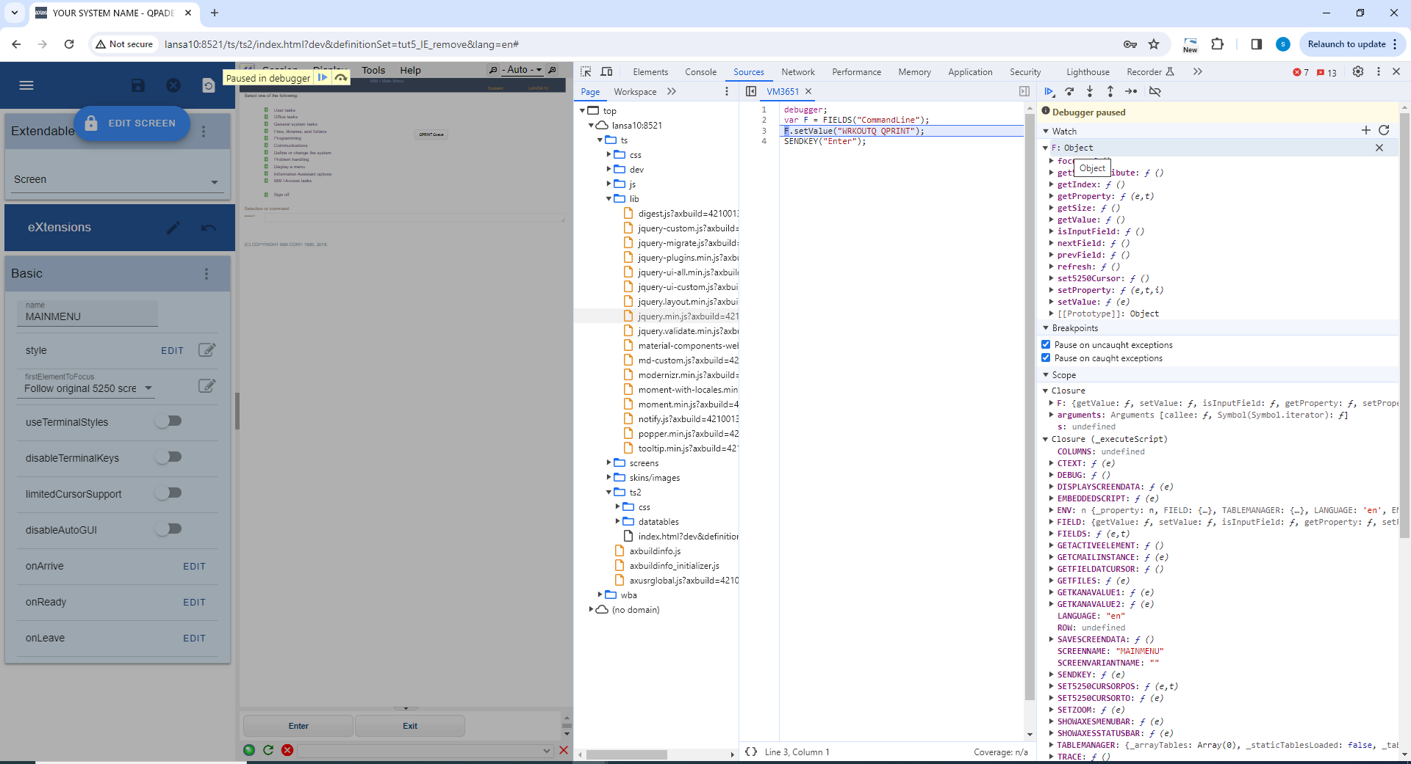
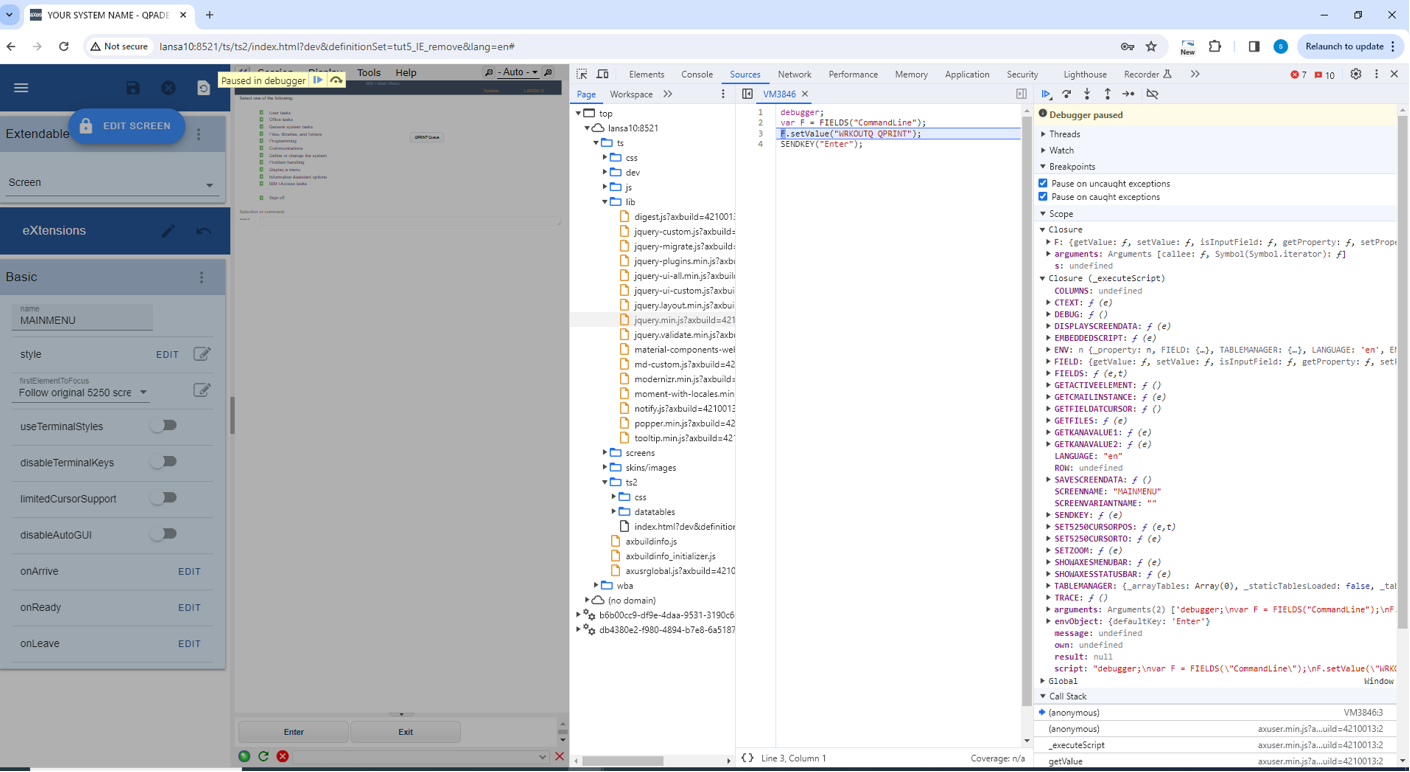
debugger; var F = FIELDS("CommandLine"); F.setvalue("WRKOUTQ QPRINT"); SENDKEY("Enter");
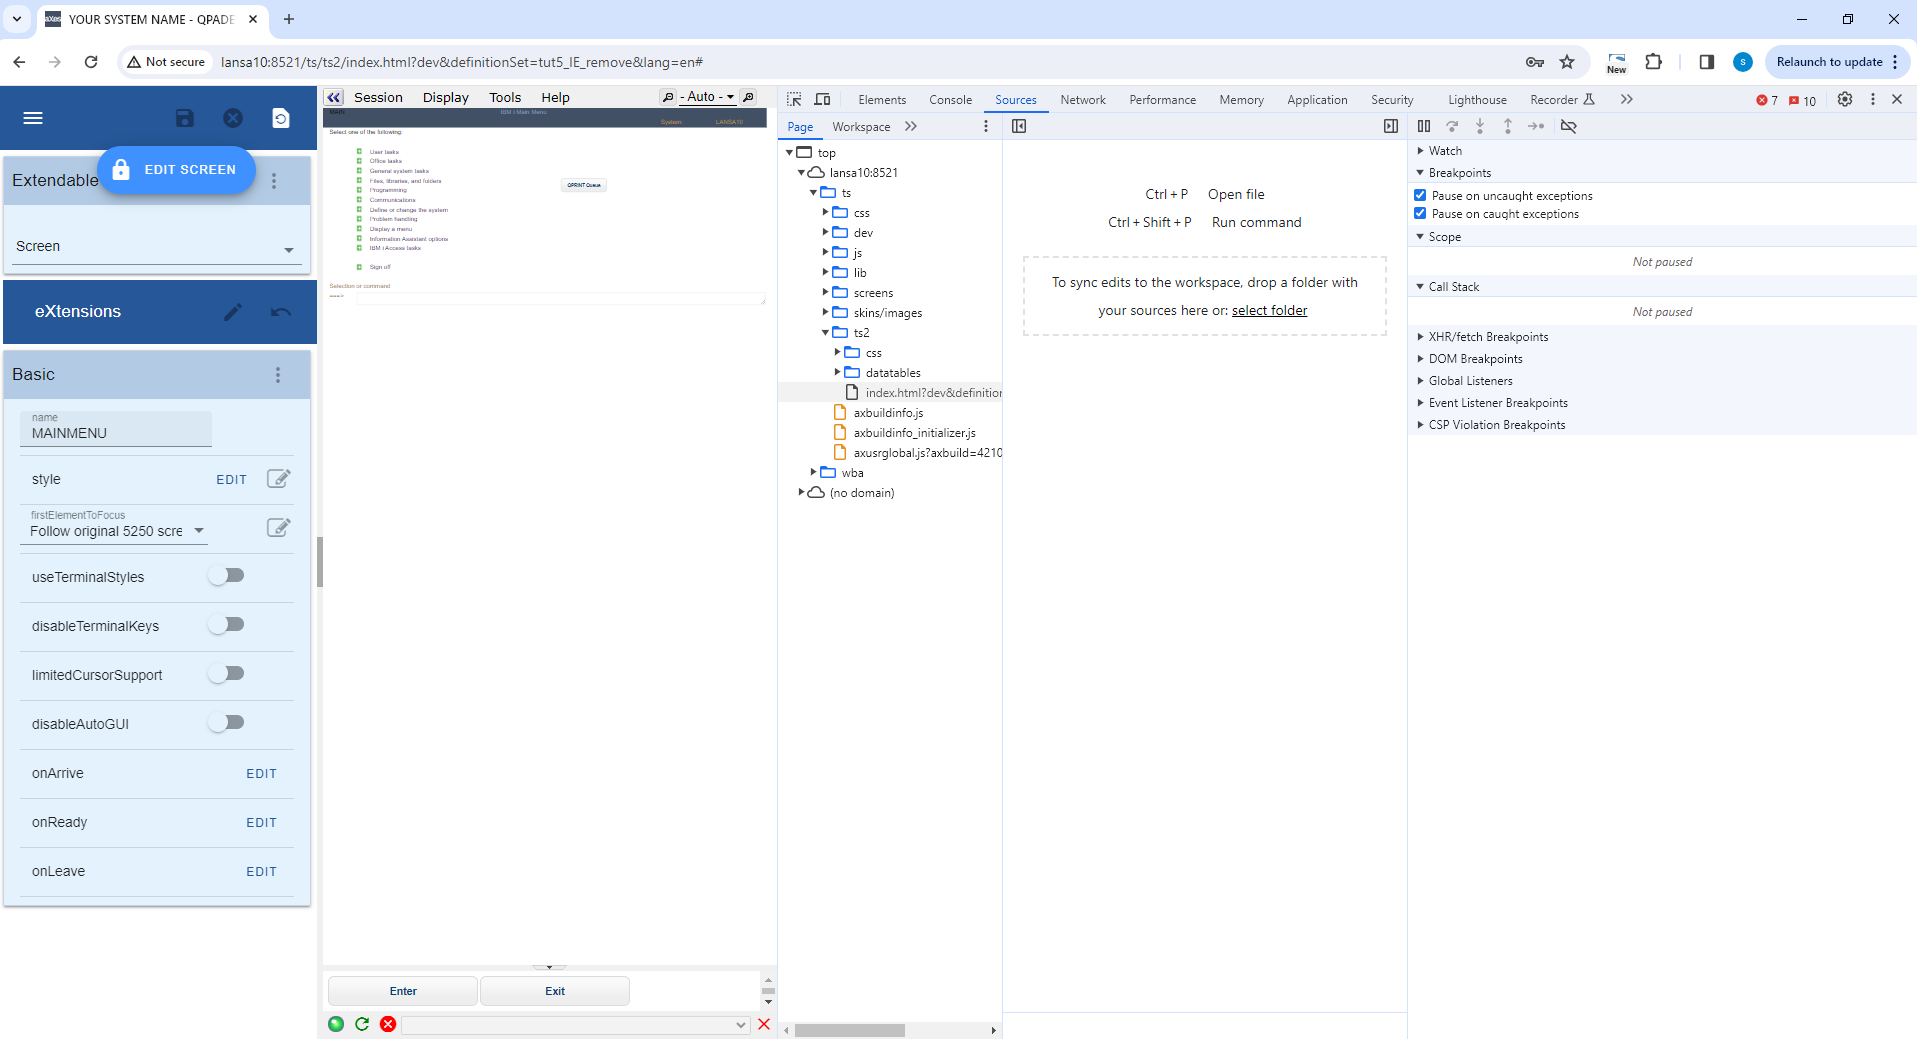
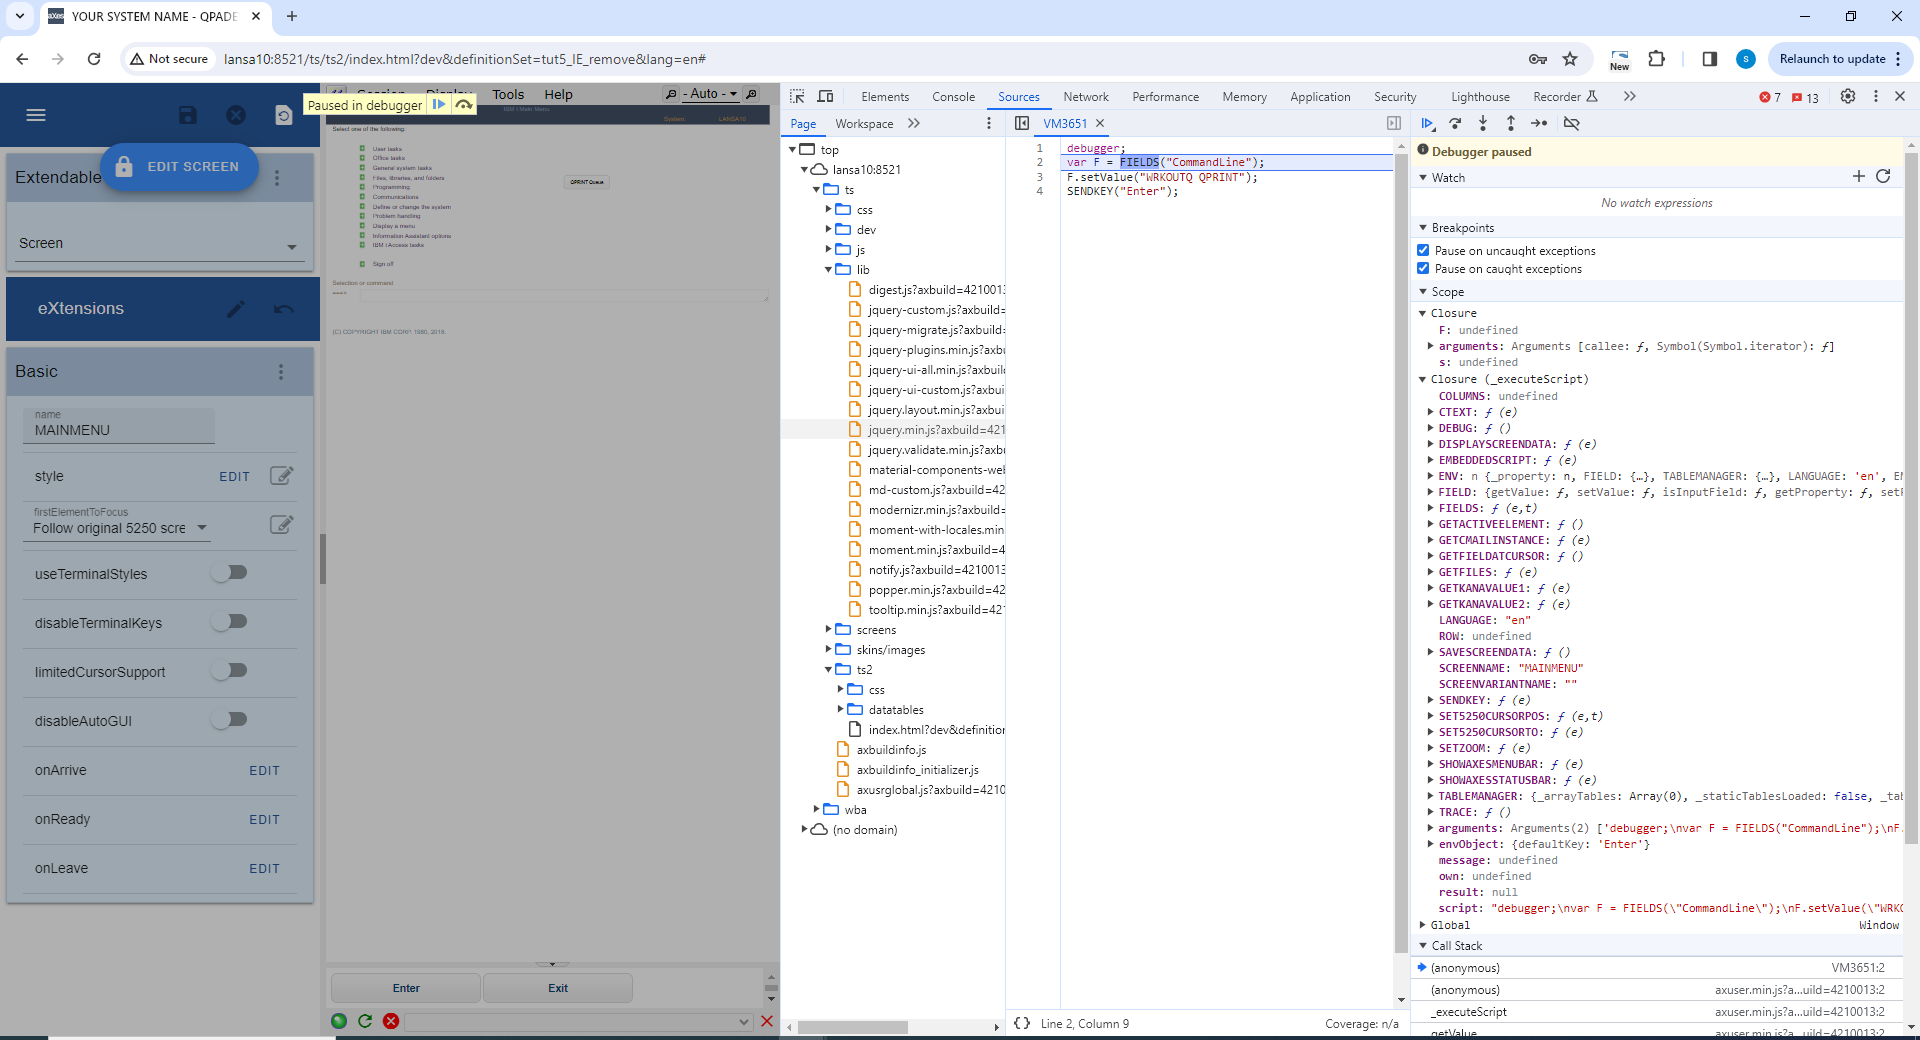
In the browser window, open the Web Developer Tools or use Ctrl + Shift + I to open browser in debugger mode:
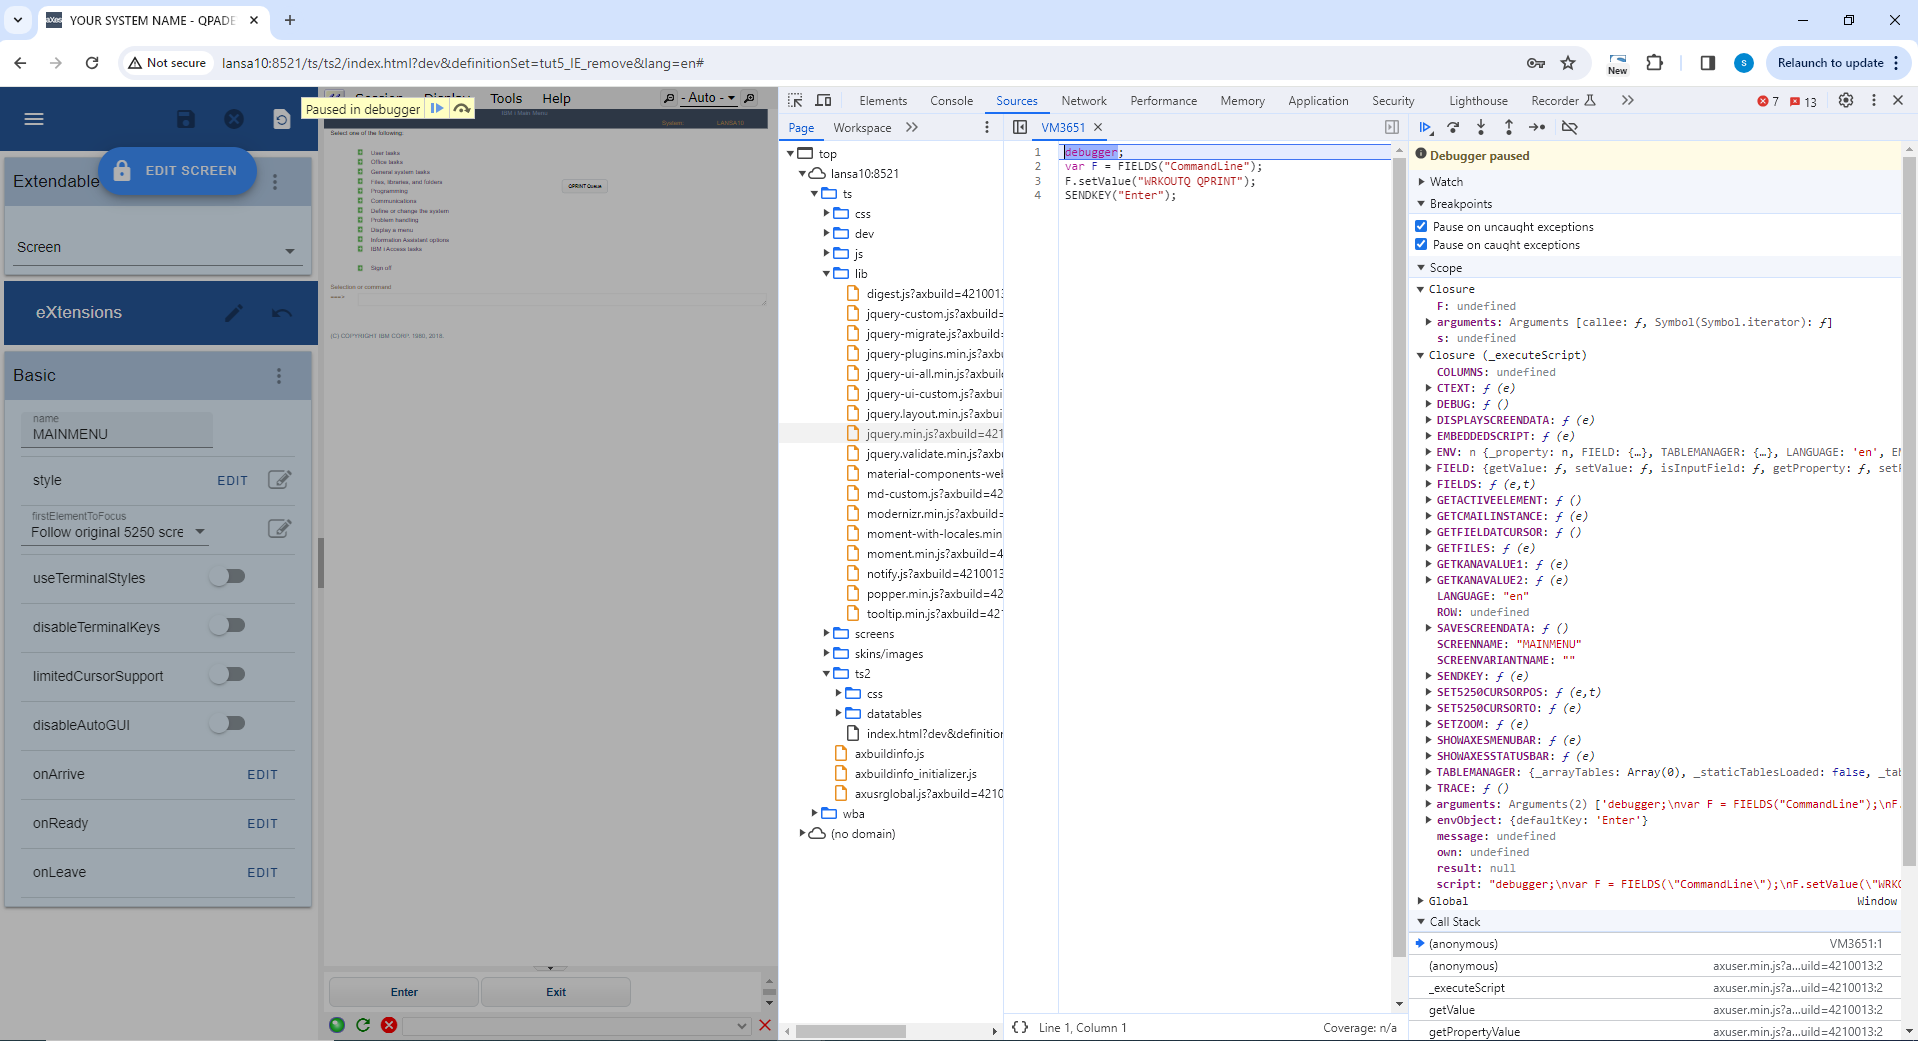
When you click on the button that runs the onClick script containing the error, the debug window will come up:
Have a closer look at toolbar buttons. Hover your mouse over those buttons to see the descriptions:
- Play / Pause (F8) : pauses or resumes execution of the script you're debugging.
- Step over: advance to the next line in the same function.
- Step in: advance to the next line in the function, unless on a function call, in which case enter the function being called.
- Step out: run to the end of the current function, in which case, the debugger will skip the return value from a function, returning execution to the caller.
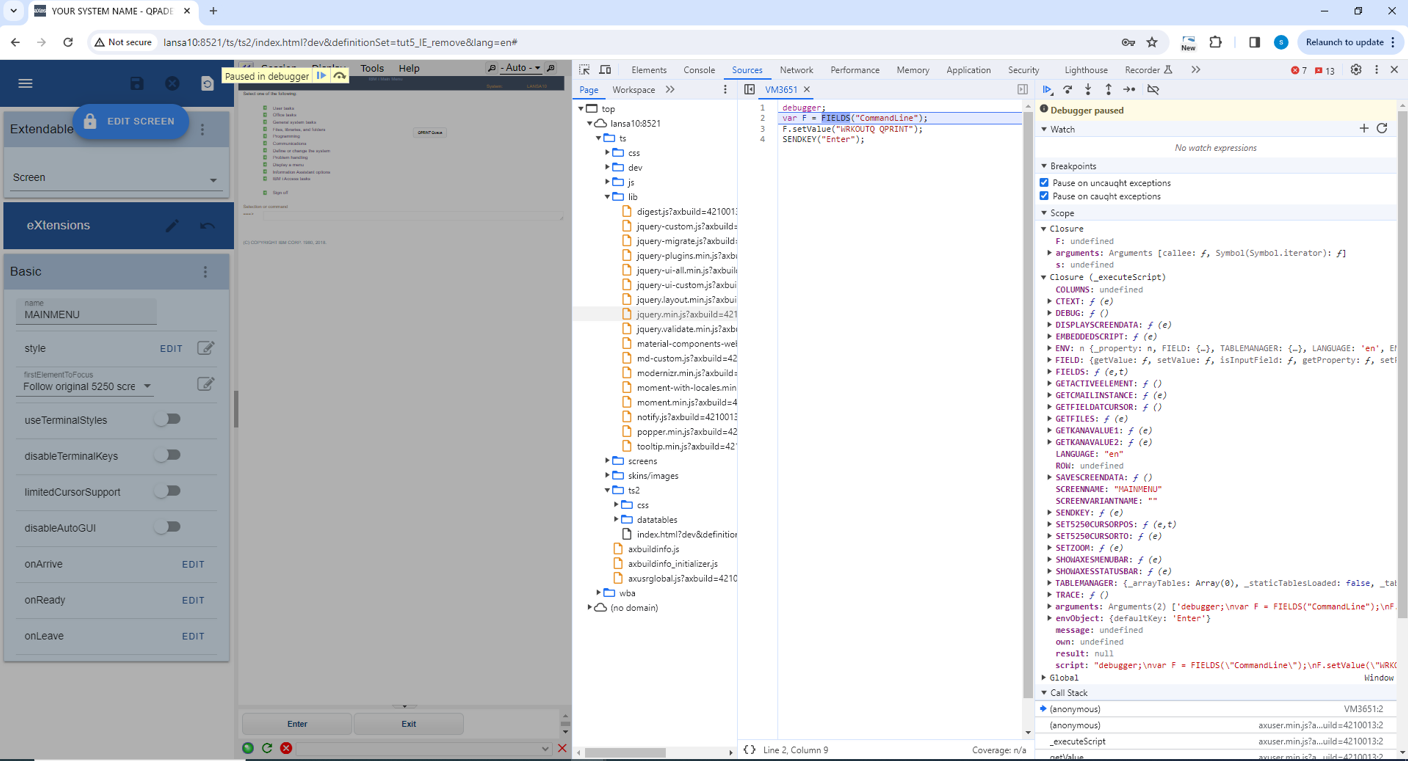
Now click on “Step Over” button. (This steps over the internal code statements, to the next statement in the visible block of code).
You can see that it’s moving to the next statement. Note that the highlighted statement is the next statement to be executed – so it hasn’t been executed yet.
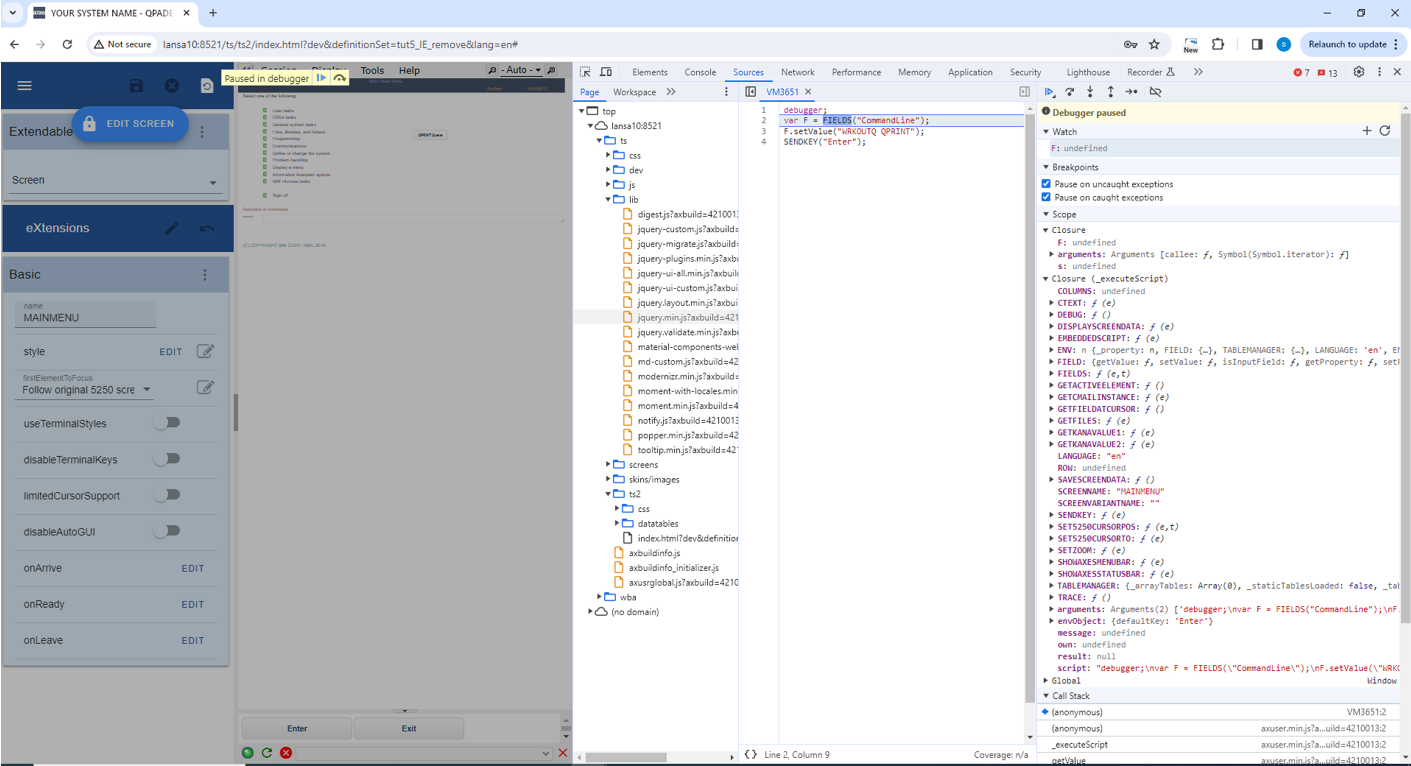
Now click on the “Watch” tab – we are going to watch the content of variable F.
Click on the text “Click to add…” and type in F and press Enter. It will say undefined as the statement hasn’t been executed yet.

Click again the “Step Over” button.
Now by expanding F, in the Watch tab, you can see all its properties.

But we have not encountered the error yet.
Try step over, one more time. This time we can see that the previous line was the source of the error. A few more step overs will take us to the actual alert.
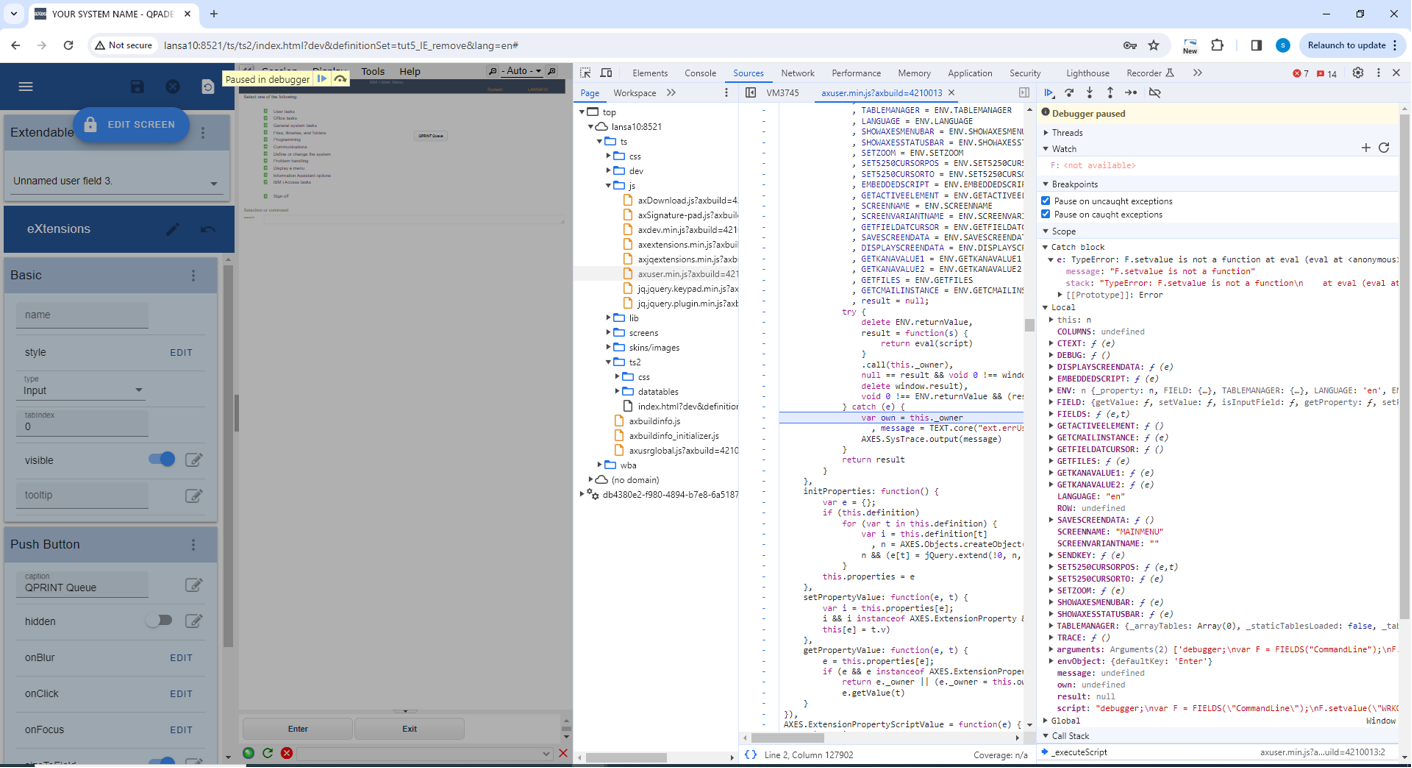
So at this point, we would know to focus our attention on the line
F.setvalue("WRKOUTQ QPRINT");
Correct the line back to:
F.setValue("WRKOUTQ QPRINT");
and save your change.
For all Modern Browsers, the appearance of the Debugger window has changed but the behavior of the functions is still the same.
Using Fiddler
Fiddler is a free tool that allows you to watch the traffic sent between the server and the client, as your axes application runs.
You can find out about it and download it from here:
http://www.fiddler2.com/fiddler/help/
Install fiddler, and start it. Then start an axes session.
It produces a screen like this:
where each line in the left panel corresponds to a request and response from the web server
On the panel on the right, in the inspectors tab, is the information about the request sent (top panel) and the response received (bottom panel), for the selected line:
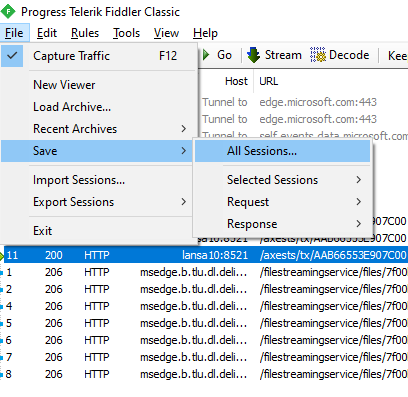
There are many views and features in this product, but one particularly useful one is the ability to save either one or all sessions to file, which can be sent when trying to resolve problems.
To save one session, select it and save as follows:
To save all sessions: