axGoogleChart_Classic
Description
axGoogleChart allows to embed a Google Chart into your screen.
By using this eXtension you will be subject to the Google Terms of Service as outlined in https://developers.google.com/chart/terms
Usability
|
Context |
Supported |
|---|---|
|
Input screen fields |
No |
|
Output screen fields |
No |
|
Input subfile fields |
No |
|
Output subfile fields |
No |
|
New screen elements |
Yes |
Properties
|
Name |
Description and Comments |
JavaScript |
Shipped default |
|---|---|---|---|
|
appendString |
For sourceParmString = table, append this string to the URL parameters. |
No |
Blank |
|
axis |
Chart axes to show. Maps to the chxt= Google chart parameter and must be specified according to its rules. |
No |
x |
|
colors |
The colors to apply to the chart. Maps to the chco= Google chart parameter and must be specified according to its rules. |
No |
Blank |
|
legends |
Chart legends. Maps to the chdl= Google chart parameter and must be specified according to its rules. |
No |
Blank |
|
onLoadChart |
Code to execute prior to invoking the Google Chart URL. |
Yes |
Blank |
|
sourceParmString |
The source of the parameters to add to the google chart URL. |
No |
Table |
|
tableName |
For sourceParmString = table, supply the table name where to get the parameter URL information from. This must be the same name as the one specified in the getTable() call – see onLoadChart and examples. And make sure that the table name used does not exist in static and dynamic table files to avoid conflict with other extensions. Please refer to Notes. |
No |
Blank |
|
title |
The title of the Google Chart. |
No |
Blank |
|
type |
The type of Google Chart. Maps to the cht= Google chart parameter. |
No |
Blank |
|
userString |
For sourceParmString = User String, supply a valid string to append to the Google Chart URL as parameters. |
No |
Blank |
Notes, Comments and Warnings
To use this extension you must be familiar with Google charts.
Information about Google charts can be found at: https://developers.google.com/chart
This extension provides a mechanism to build the URL parameter string to append to the Google Chart URL. In other words, given the Google Chart URL https://developers.google.com/chart
this extension appends the ?<parameters> to it.
As such it relies on the functionality provided by the Google Chart API.
There are 2 ways to build the parameters based on the value of the sourceParmString property.
Setting the sourceParmString to User String requires the user to enter the entire string to append to the URL in the userString parameter.
The only property that is evaluated when choosing User String is userString.
When sourceParmString is set to Table the user must create and fill a table using the onLoadChart property and specify its name in the tableName property. The table row object must conform to this structure:
|
Property Name |
Type |
Mandatory |
Description |
|
chartData |
String |
Yes |
The data used by Google to draw the chart. Google Parameter: chd Note: this extension implements only chd=t |
|
dataSet |
String |
No |
A string to identify a dataSet. Required only when the chart is made of more than one set of data. |
|
chartLabel |
String |
No |
A label for the chartData |
When the value specified in tableName property is the same as those defined in static and dynamic table files (e.g. tables_static.txt), this extension deletes all the rows of that table then replaces it with the data specified in the script of onLoadChart property. If in any case, another extension like dropdown or google chart (modern) uses the same table, table-related errors occur. If this happens, specify a different name to tableName and onLoadChart property of this extension, save and then sign off and open the project again to reload the static and dynamic table files.
Here is some sample code to put into the onLoadChart property.
This code creates a table called Rainfall by month …
var t1 = TABLEMANAGER.getTable("Rainfall");
t1.insertChild ({chartData:"10",chartLabel:"Jan"});
t1.insertChild ({chartData:"25",chartLabel:"Feb"});
t1.insertChild ({chartData:"5",chartLabel:"Mar"});
t1.insertChild ({chartData:"40",chartLabel:"Apr"});
t1.insertChild ({chartData:"15",chartLabel:"May"});
t1.insertChild ({chartData:"15",chartLabel:"Jun"});
t1.insertChild ({chartData:"10",chartLabel:"Jul"});
t1.insertChild ({chartData:"25",chartLabel:"Aug"});
t1.insertChild ({chartData:"5",chartLabel:"Sep"});
t1.insertChild ({chartData:"40",chartLabel:"Oct"});
t1.insertChild ({chartData:"15",chartLabel:"Nov"});
t1.insertChild ({chartData:"15",chartLabel:"Dec"});
Together with these Chart properties …

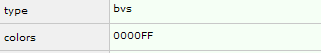
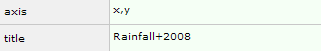
produce this chart:

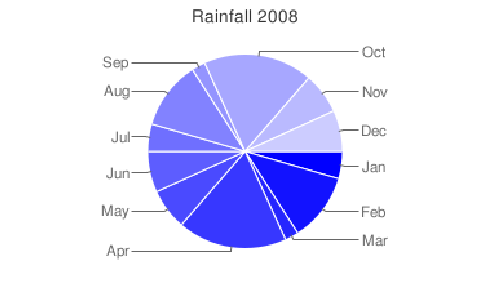
To produce a Pie chart with the same data set the Type property to p
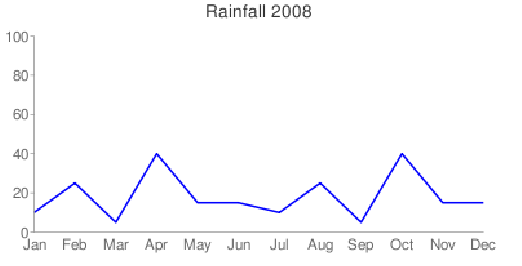
For a line chart set the Type property to lc
Using more than one data set.
To show more than one data set you must identify the row being inserted as belonging to a specific set. To do this use the optional dataSet property.
We can extend the above example by adding the Rainfall for the year 2007.
First we would have to add the dataSet to the existing 2008 data:
t1.insertChild ({dataSet:"A",chartData:"10",chartLabel:"Jan"});
t1.insertChild ({dataSet:"A",chartData:"25",chartLabel:"Feb"});
t1.insertChild ({dataSet:"A",chartData:"5",chartLabel:"Mar"});
t1.insertChild ({dataSet:"A",chartData:"40",chartLabel:"Apr"});
t1.insertChild ({dataSet:"A",chartData:"15",chartLabel:"May"});
t1.insertChild ({dataSet:"A",chartData:"15",chartLabel:"Jun"});
t1.insertChild ({dataSet:"A",chartData:"10",chartLabel:"Jul"});
t1.insertChild ({dataSet:"A",chartData:"25",chartLabel:"Aug"});
t1.insertChild ({dataSet:"A",chartData:"5",chartLabel:"Sep"});
t1.insertChild ({dataSet:"A",chartData:"40",chartLabel:"Oct"});
t1.insertChild ({dataSet:"A",chartData:"15",chartLabel:"Nov"});
t1.insertChild ({dataSet:"A",chartData:"15",chartLabel:"Dec"});
Next we add the second set using a different identifier than the "A" used above. Note also that we don't to specify chart labels:
t1.insertChild ({dataSet:"B",chartData:"50"});
t1.insertChild ({dataSet:"B",chartData:"38"});
t1.insertChild ({dataSet:"B",chartData:"77"});
t1.insertChild ({dataSet:"B",chartData:"9"});
t1.insertChild ({dataSet:"B",chartData:"30"});
t1.insertChild ({dataSet:"B",chartData:"55"});
t1.insertChild ({dataSet:"B",chartData:"90"});
t1.insertChild ({dataSet:"B",chartData:"11"});
t1.insertChild ({dataSet:"B",chartData:"5"});
t1.insertChild ({dataSet:"B",chartData:"66"});
t1.insertChild ({dataSet:"B",chartData:"33"});
t1.insertChild ({dataSet:"B",chartData:"30"});
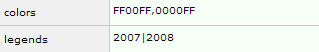
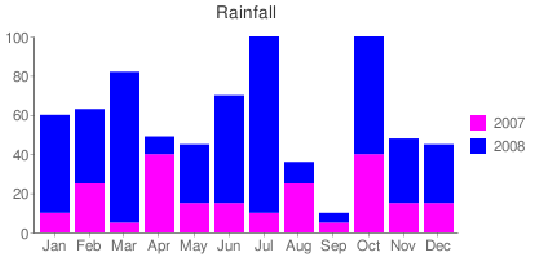
Using the legends property we can add a legend for the 2007 and 2008 sets, change the title and add a color to the colors property for the second set like this:

Result for the Bar Chart (type bvs):
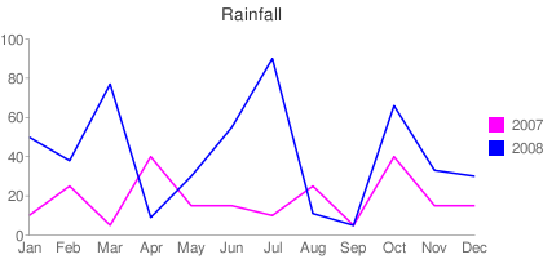
Result for the Line Chart (type lc):
Pie charts are not suitable to display more than one data set.
See Also
Example – Dynamic Google Chart 1 in Tutorial 13 - FAQ and Examples
Example – Dynamic Google Chart 2 in Tutorial 13 - FAQ and Examples